

The holy grail of creating blazing fast cli applications
Profiling is a useful technique for identifying performance bottlenecks, inspecting memory consumption, and gaining insight about garbage collection overhead, among other things. The Go ecosystem provides fantastic tooling for that matter. Being able to switch profiling on and off is especially helpful when debugging a Go CLI application.
In this blog post we will add profiling to a simplified version of the cli package which we created in a previous blog post. You can find the full implementation for this post here.
When to Profile?
The most common use cases for profiling are:
- discovering performance bottlenecks and resolving them, in order to improve overall performance, and
- finding excess memory allocations and minimizing them, so as to reduce the performance penalty of garbage collection.
Let's get started!
We rely on spf13/cobra to parse CLI flags. The project created in this post is structured in the following way:
project
│   main.go
│
└───cli
│   │   cli.go
│   │   cmd_root.go
│   │   profiling.go
│
└───application // or 'app'
    │   // your app code
Flags to Toggle Profiling
Enabling profiling reduces the runtime performance of a binary. Therefore, we want to only enable it when it's absolutely necessary.
The following parameters enable us to alter the behavior as needed:
--cpu-profileenables CPU profiling--mem-profileenables memory profiling--cpu-profile-filedefines the file where the CPU profile will be saved--mem-profile-filedefines the file where the memory profile will be saved
These variables can easily be added to our application by declaring them as variables of the 'cli' package in the cli.go file:
// CLIParameters
var (
    cpuProfile     bool
    memProfile     bool
    cpuProfileFile string
    memProfileFile string
)
Then, we only need to create CLI flags for these parameters in the init function of cli.go:
// init is called before main
func init() {
    // Profiling cli flags
    rootCmd.PersistentFlags().BoolVar(&cpuProfile, "cpu-profile", false, "write cpu profile to file")
    rootCmd.PersistentFlags().BoolVar(&memProfile, "mem-profile", false, "write memory profile to file")

    rootCmd.PersistentFlags().StringVar(&cpuProfileFile, "cpu-profile-file", "cpu.prof", "write cpu profile to file")
    rootCmd.PersistentFlags().StringVar(&memProfileFile, "mem-profile-file", "mem.prof", "write memory profile to file")
}
Starting Profiling
With these parameters defined, we can start profiling the application. For this, we create a file called profiling.go, and add the function profilingInit.
We need a way to stop profiling and save the profile into a file. The stop signal will make sure that profiling is gracefully terminated and the result is written to a file for later inspection. Hence, we return a function that will stop the profiling. This function will be called when the application is shutting down. Since multiple profiling functions can be started we will use a list of functions to be called on stop. This way we can add multiple functions to the list and call them all when the application is shutting down.
// profilingInit starts cpu and memory profiling if enabled.
// It returns a function to stop profiling.
func profilingInit() (stop func()) {

    // Assemble stop function

    // doOnStop is a list of functions to be called on stop
    var doOnStop []func()

    // stop calls all necessary functions to stop profiling
    stop = func() {
        for _, d := range doOnStop {
            if d != nil {
                d()
            }
        }
    }

    // Start cpu profiling if enabled
    // ...

    // Start memory profiling if enabled
    // ...

    return stop
}
CPU Profiling
... shows which functions are called and how long they take to execute. This also includes calls from the garbage collection process. We can extend our profilingInit as follows, in order to set up CPU Profiling:
// profilingInit starts cpu and memory profiling if enabled.
// It returns a function to stop profiling.
func profilingInit() func() {

    // Assemble stop function
    // ...

    // Start cpu profiling if enabled
    if CPUProfile {

        fmt.Println("cpu profile enabled")

        // Create profiling file
        f, err := os.Create(CPUProfileFile)
        if err != nil {
            fmt.Println("could not create cpu profile file")
            return stop
        }

        // Start profiling
        err = pprof.StartCPUProfile(f)
        if err != nil {
            fmt.Println("could not start cpu profiling")
            return stop
        }

        // Add function to stop cpu profiling to doOnStop list
        doOnStop = append(doOnStop, func() {
                pprof.StopCPUProfile()
                _ = f.Close()
                fmt.Println("cpu profile stopped")
            })
    }

    // Start memory profiling if enabled
    // ...

    return stop
}
Memory Profiling
... shows the memory consumption of the application. To set it up, we add the following segment to our profilingInit function:
// profilingInit starts cpu and memory profiling if enabled.
// It returns a function to stop profiling.
func profilingInit() func() {

    // Assemble stop function
    // ...

    // Start cpu profiling if enabled
    // ...

    // Start memory profiling if enabled
    if MEMProfile {

        fmt.Println("memory profile enabled")

        // Create profiling file
        f, err := os.Create(MEMProfileFile)
        if err != nil {
            fmt.Println("could not create memory profile file")
            return stop
        }

        // Add function to stop memory profiling to doOnStop list
        doOnStop = append(doOnStop, func() {
                _ = pprof.WriteHeapProfile(f)
                _ = f.Close()
                fmt.Println("memory profile stopped")
            })
    }

    return stop
}
Stopping Profiling
Now that we have a way to start profiling, we also need a way to stop it. This is required, as the profiling results will not be saved unless we stop the profiling process. To achieve this, we will use a global stopProfiling function. This function will be called when the application is shutting down. It will call the onStopProfiling function, which will stop all the profiling functions we have already started. We will use a sync.Once to make sure this function is only called once.
// onStopProfiling is called when the cli exits
// profilingOnce makes sure it's only called once
var onStopProfiling func()
var profilingOnce sync.Once

// stopProfiling triggers _stopProfiling.
// It's safe to be called multiple times.
func stopProfiling() {
    if onStopProfiling != nil {
        profilingOnce.Do(onStopProfiling)
    }
}
It is necessary to assure stopProfiling is called before the program exits. An easy way to do this is to wrap it in a function called Execute(), which will be used to start the entire application. The actual call to stopProfiling will be deferred inside the cli.Execute function. This way we can be sure that the onStopProfiling function is called when the application is shutting down.
// Execute is the entry point for the cli
// called from main
func Execute() error {
    defer stopProfiling()
    return rootCmd.Execute()
}
Disclaimer: If you exit your program using os.Exit(), defered functions are not called. Make sure to keep this in mind.
Cobra offers the PersistentPreRun function, which is called for all commands, unconditionally. Adding the line onStopProfiling = profilingInit() assures it's always initialized correctly and all of our commands can be profiled whenever necessary.
var rootCmd = &cobra.Command{
    Use:   "our_app",
    Short: "cli to start example server & client",
    Long:  "cli to start example server & client",
    PersistentPreRun: func(cmd *cobra.Command, args []string) {
        // set the onStopProfiling function
        onStopProfiling = profilingInit()
    },
    Run: // ...
}
Flipping the Switch
Now that we have a way to start and stop profiling we can finally use it in our CLI.
./our_app --cpu-profile --mem-profile
Note: As mentioned in go.dev/doc/diagnostics using both cpu and memory profiling simultaneously will result in loss of precision. If you want more precise details it is recommended to only use one profiling at a time.
Example
Let's see the above in action with a real application.
We are using github.com/benchkram/bob, an open-source multi-language build tool we created.
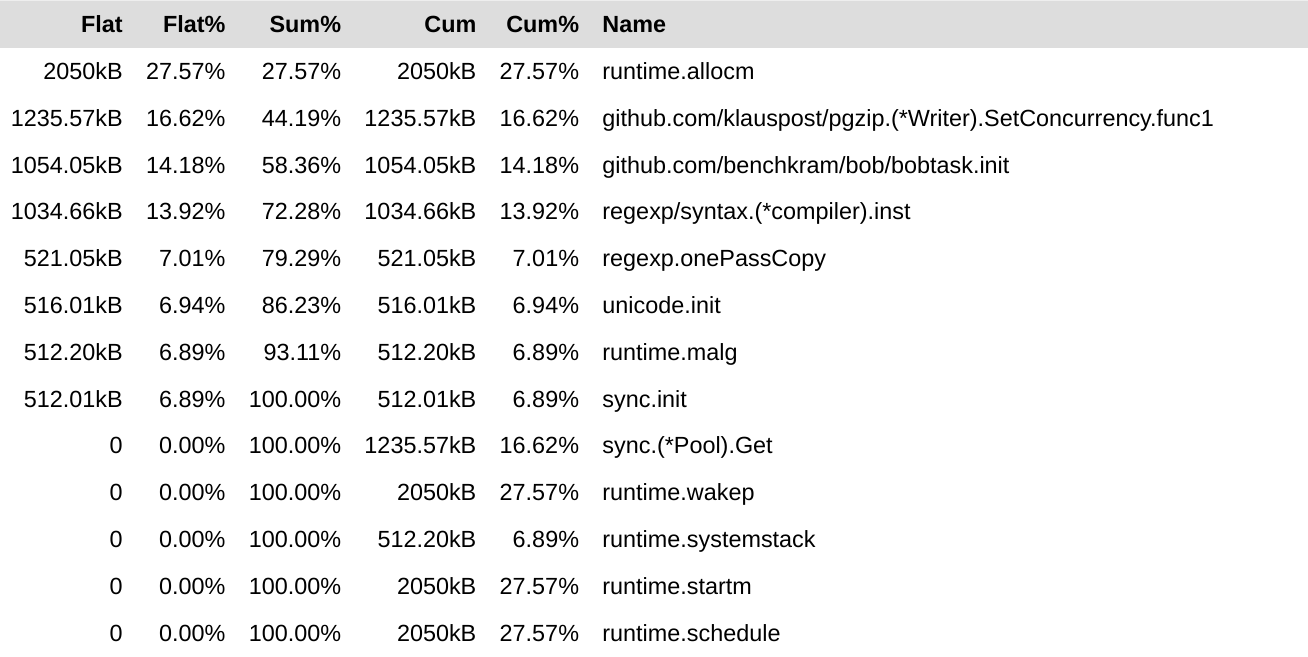
Let's analyze the bob build command. After we set up our example project’s bob.yaml file, we call bob build --memprofile. After the completion of the command, we can see a profiling file in the same directory. Analyzing this with go tool pprof --http localhost:3000 memprofile.prof
On the other hand, to get a CPU Profile, we run the following: bob build --cpuprofile. Now we can use the go tool pprof --http localhost:3000 cpuprofile.prof command to see a flame graph of the CPU utilization.
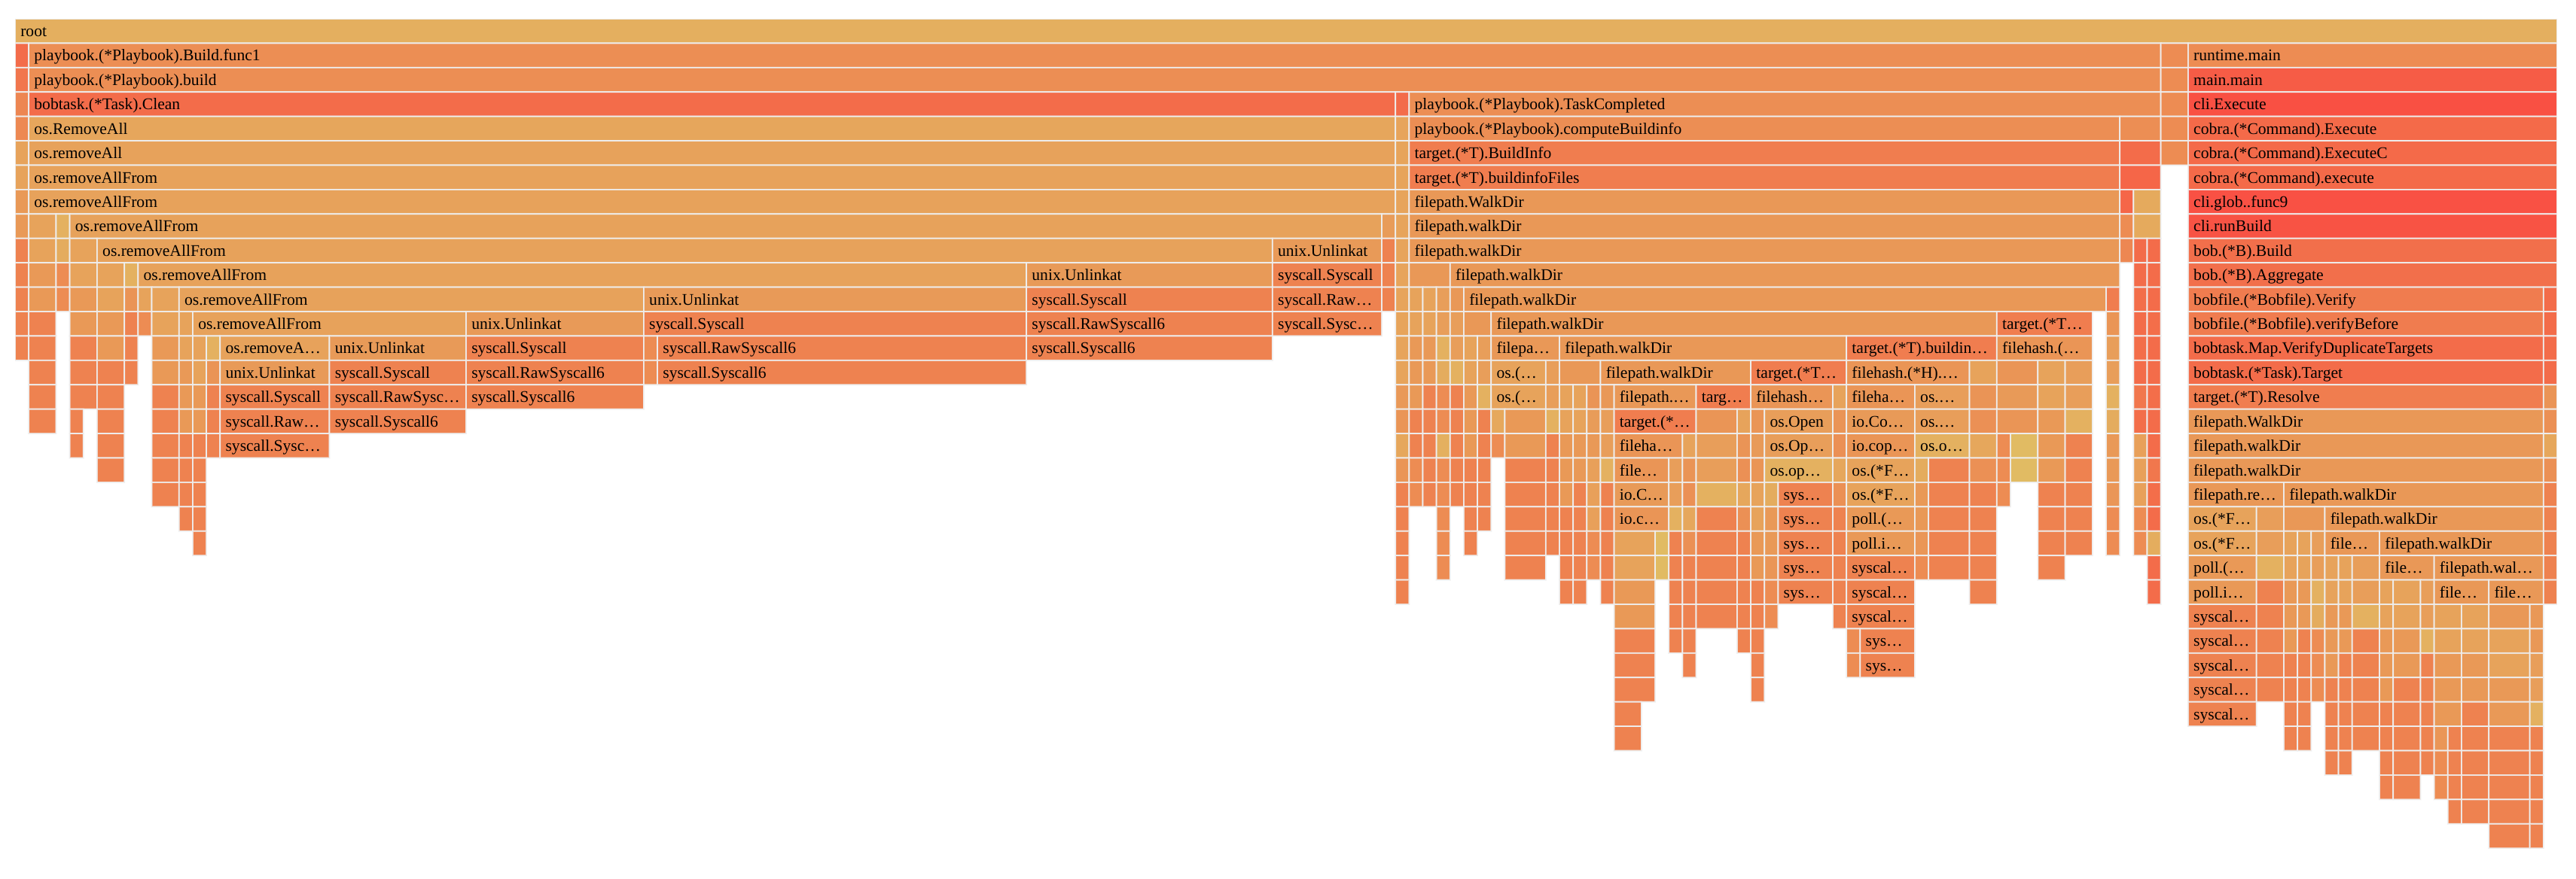
As bob is reading a lot of files, there is a lot of load because of syscall or filepath operations. Here we could now go deeper into the separate calls and see if there is room for improvement.
Conclusion
We learned how to add simple cpu and memory profiling to a cli application with cobra. We made sure that profiling is started and stopped properly and looked at a short example on how the results can be used. This and more examples can be found in our cli-utils repository.
Do you need Golang Consulting?
We are a Software Agency from Stuttgart, Germany and can support you on your journey to deliver outstanding user experiences. Reach out to us.
Something Else?
Make sure to check out our build tool for large multi-language applications: https://bob.build